Effective data / fast results
Service Analysis System (SAS)
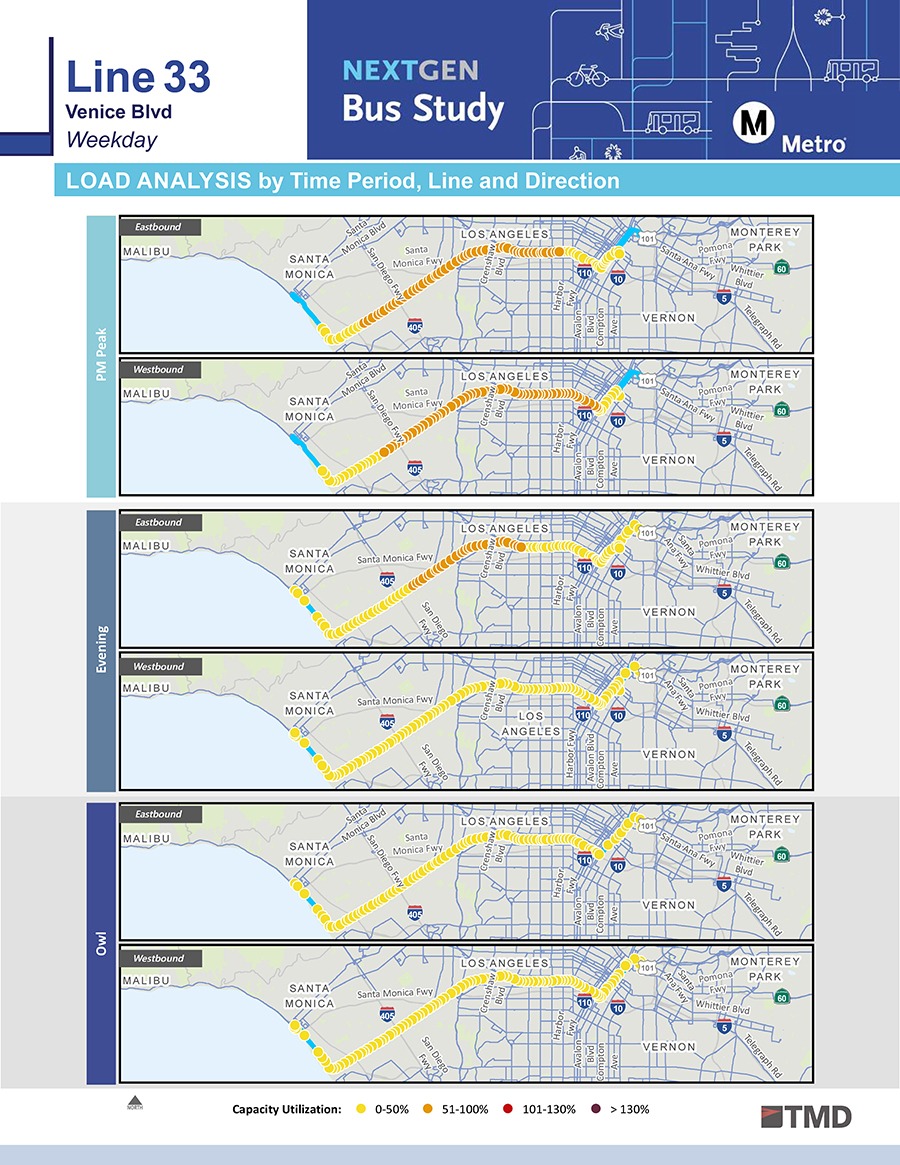
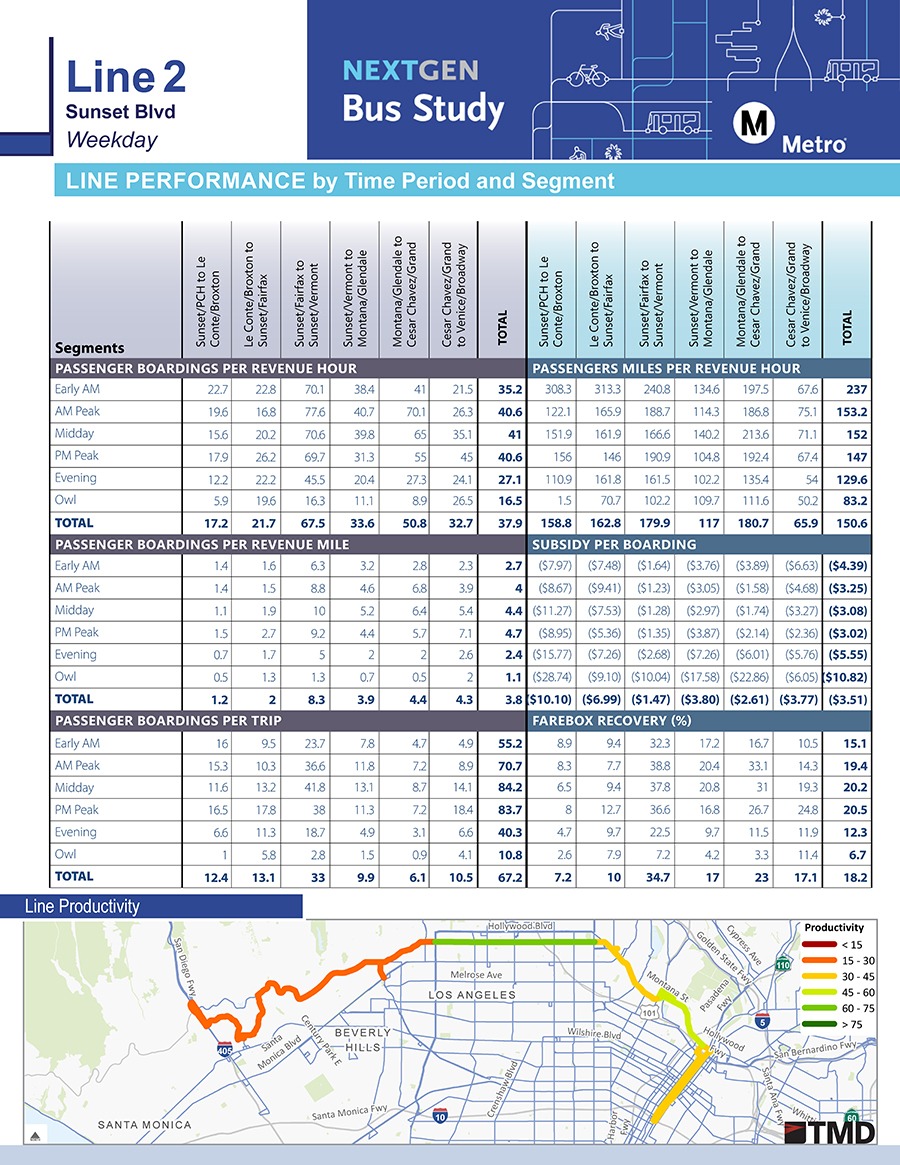
For over 20 years, TMD’s proprietary SAS program has given transit agencies the tools they need to make informed route and network-level service change decisions. The SAS cleans APC, AVL, and farebox data to create a comprehensive set of performance reports that provide a snapshot of a representative weekday, Saturday, and Sunday. Detailed ridership and performance data is provided at the stop, trip, time of day, and route segment level. Since performance can vary substantially along a route’s alignment due to ridership turnover, deviations, trip patterns, or changing surrounding market environments, segment-level analysis provides more nuanced insight into the factors contributing to a route’s overall performance. Segment analysis also allows for direct comparison between overlapping routes that share a common segment, allowing planners to analyze not just individual route performance, but corridor and network performance as well. Finally, breaking the system into smaller segments often results in a clearer picture of where the network is strongest, providing a foundation for any network restructuring project. In addition to looking at ridership and performance, the SAS reports also use AVL data to compare observed and scheduled running times between time points to identify on-time performance issues and opportunities to improve the efficiency of service delivery. The data produced by the SAS is packaged into a series of Microsoft Excel spreadsheets, PDF reports, and ArcGIS maps.
Spatial Analysis and Solutions
Geographic Information Systems (GIS)
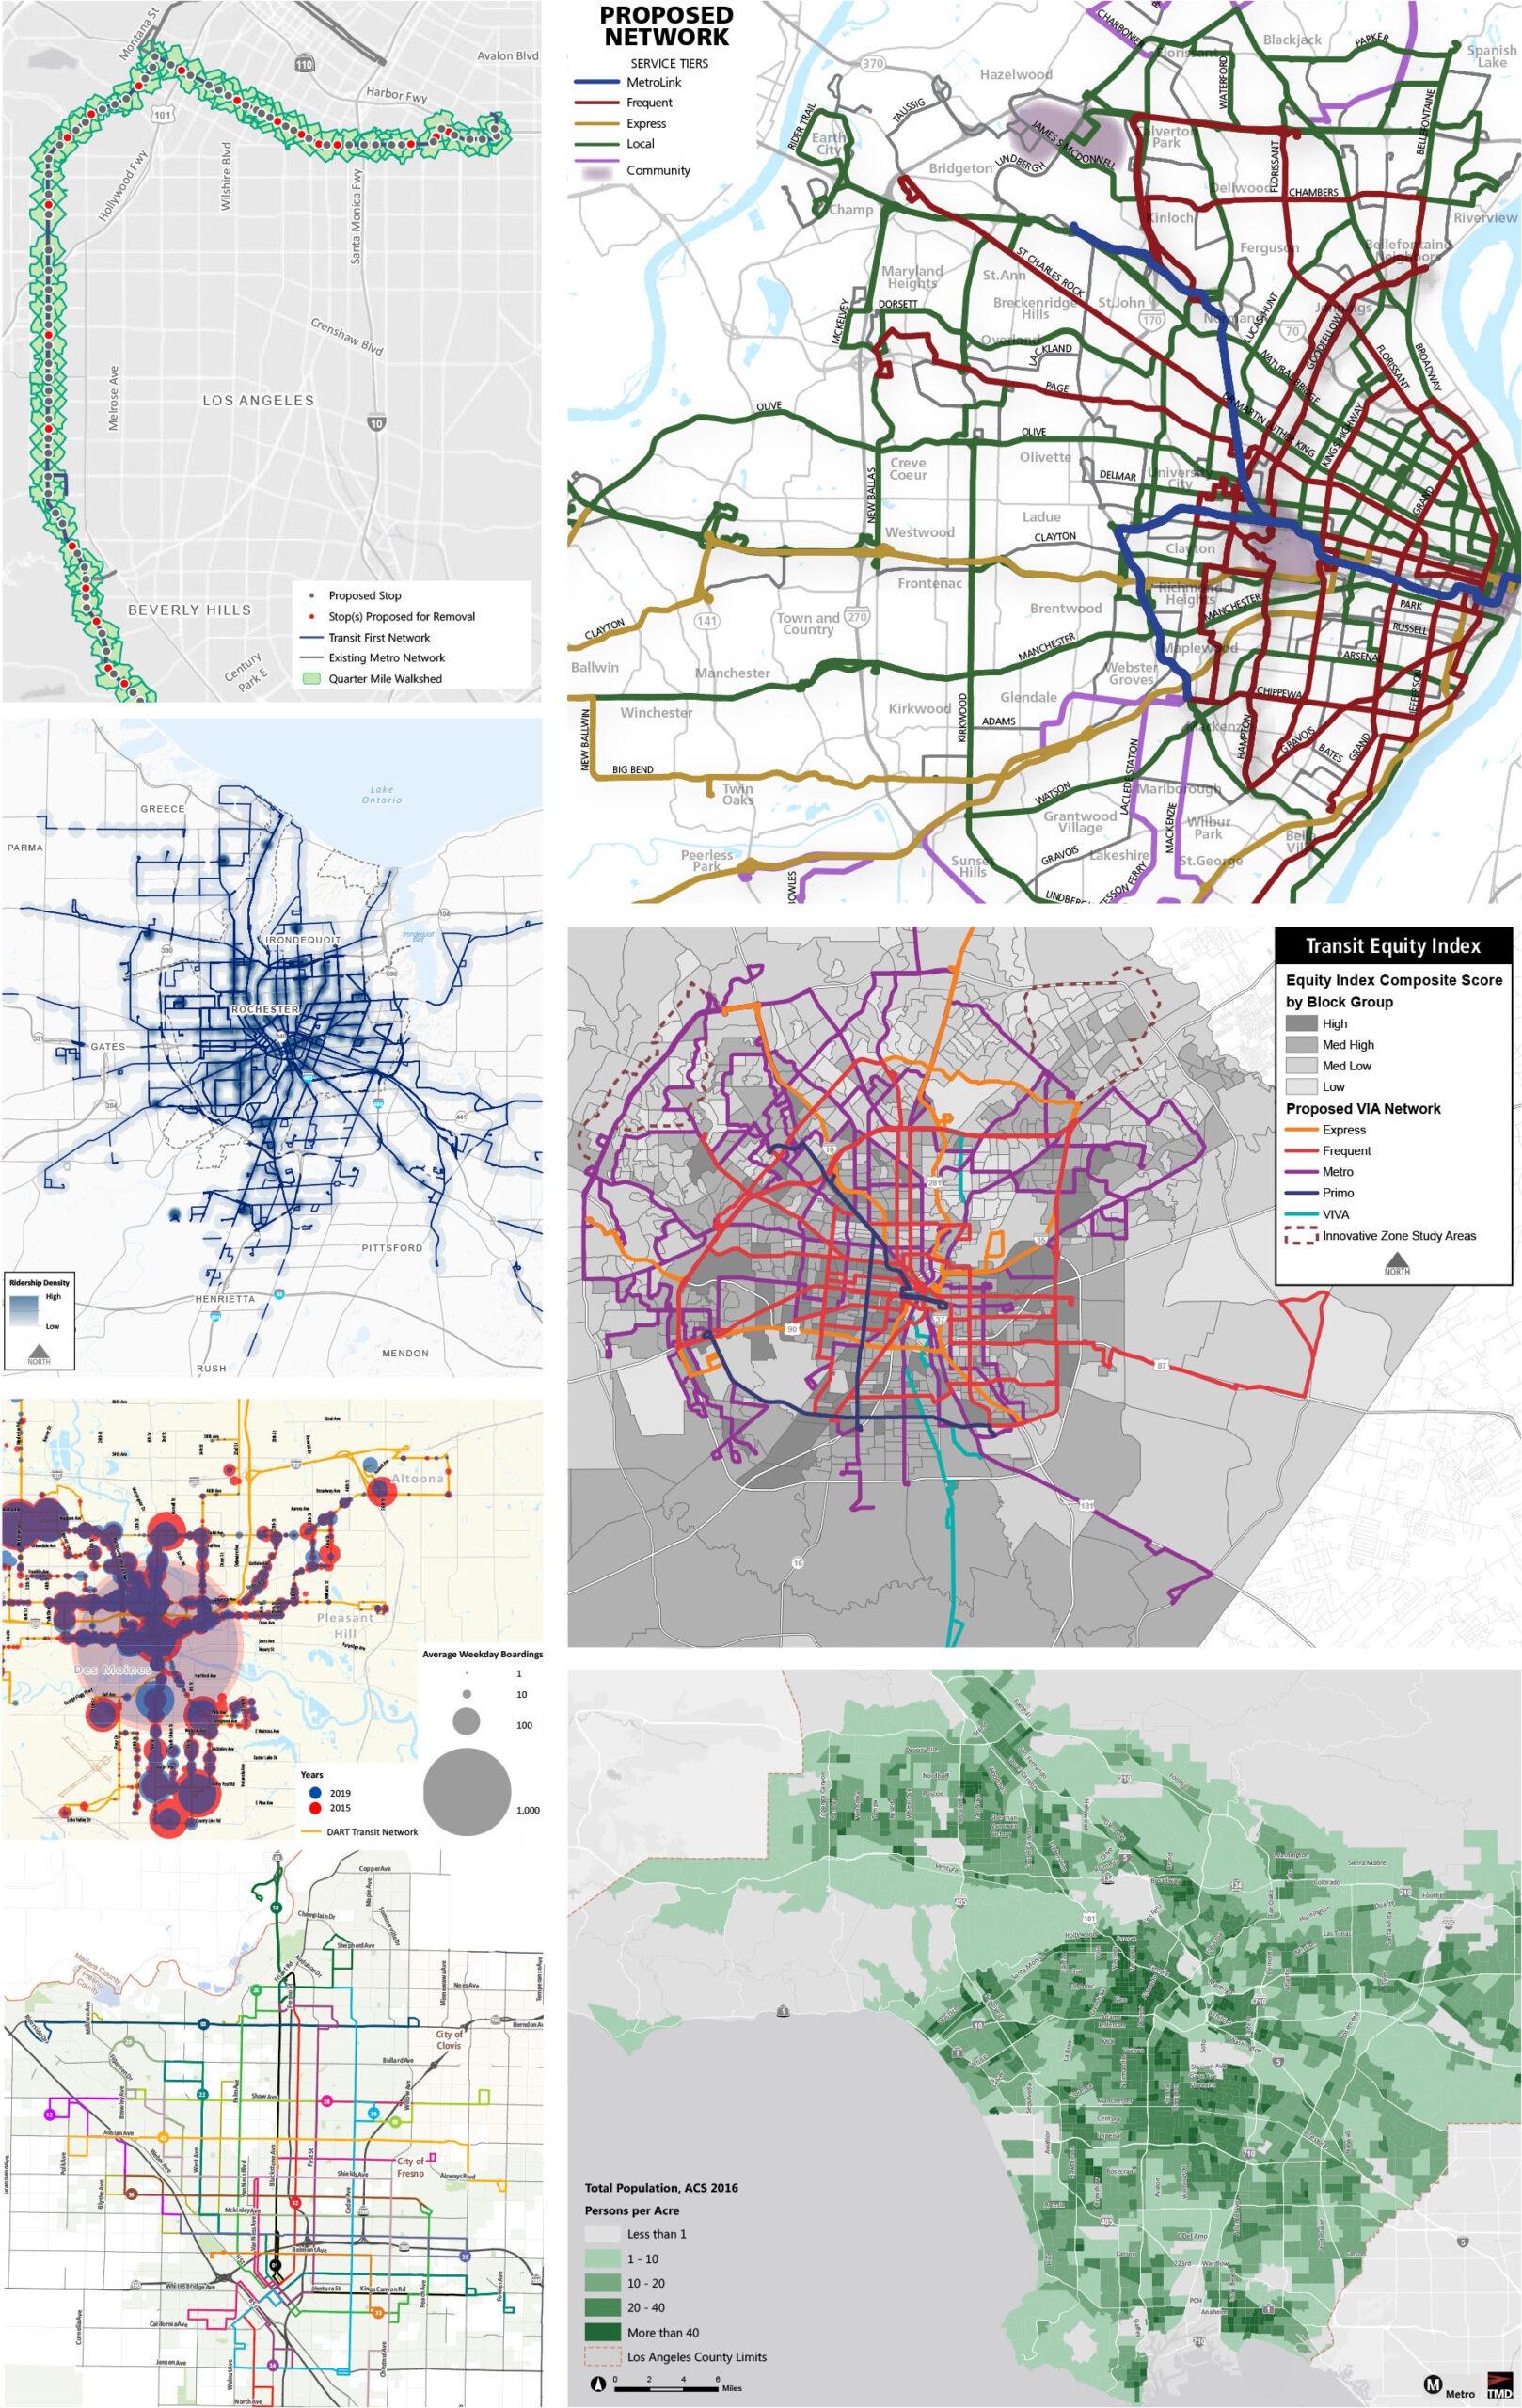
TMD uses GIS-based technologies to integrate the geographic components of mobility into the transit planning process. GIS enables us to perform mapping, spatial analysis, and visualization for each project, communicating our findings and recommendations through a geographical lens.
We use Esri and Google products to analyze and map the service and market aspects of the planning process, including ArcMap and ArcGIS Pro. We leverage demographic and survey data to identify travel demands and transit markets, mapping and analyzing where people live, where people work, and where they want to travel. Mapping service data, like transit boardings and alightings, passenger load, productivity, frequency, trips, and travel patterns, provides insight into the effectiveness of existing transit service. These geospatial analyses are essential, as they contribute to our development of service and infrastructure recommendations, highlight potential areas that would benefit from Transit-oriented development (TOD), as well as inform social equity evaluations.
 TMD also leverages interactive spatial visualization tools like ArcGIS Online, StoryMaps, and ArcGIS for Power BI which facilitates our brainstorming and digital storytelling processes, using a series of interactive maps, text, and images. These platforms enable us to communicate transit concepts and recommendations, maximizing accessibility for clients, stakeholders, and the public. Messages and ideas are instantly shareable through the click of a website link, and the visuals, supporting text, and images walk the reader through a project story at their own pace.
TMD performs complex geospatial analysis, such as using our ArcGIS Network and Spatial Analyst extensions. We can analyze and evaluate access to transit for pedestrians and cyclists, access by key demographic groups, origin and destination routing, stop spacing, and ridership density. We not only have the tools to perform advanced geospatial analysis of transit systems and environments but also the knowledge and experience to effectively visualize the technical outputs so they are visually appealing and understandable to any audience.
To sum it up, the application of GIS-based technologies at TMD is an integral part of our work, and it is critical in helping us to examine transit networks holistically and yield valuable recommendations that shape these systems for the future.
Data to Drive Decisions
Replica
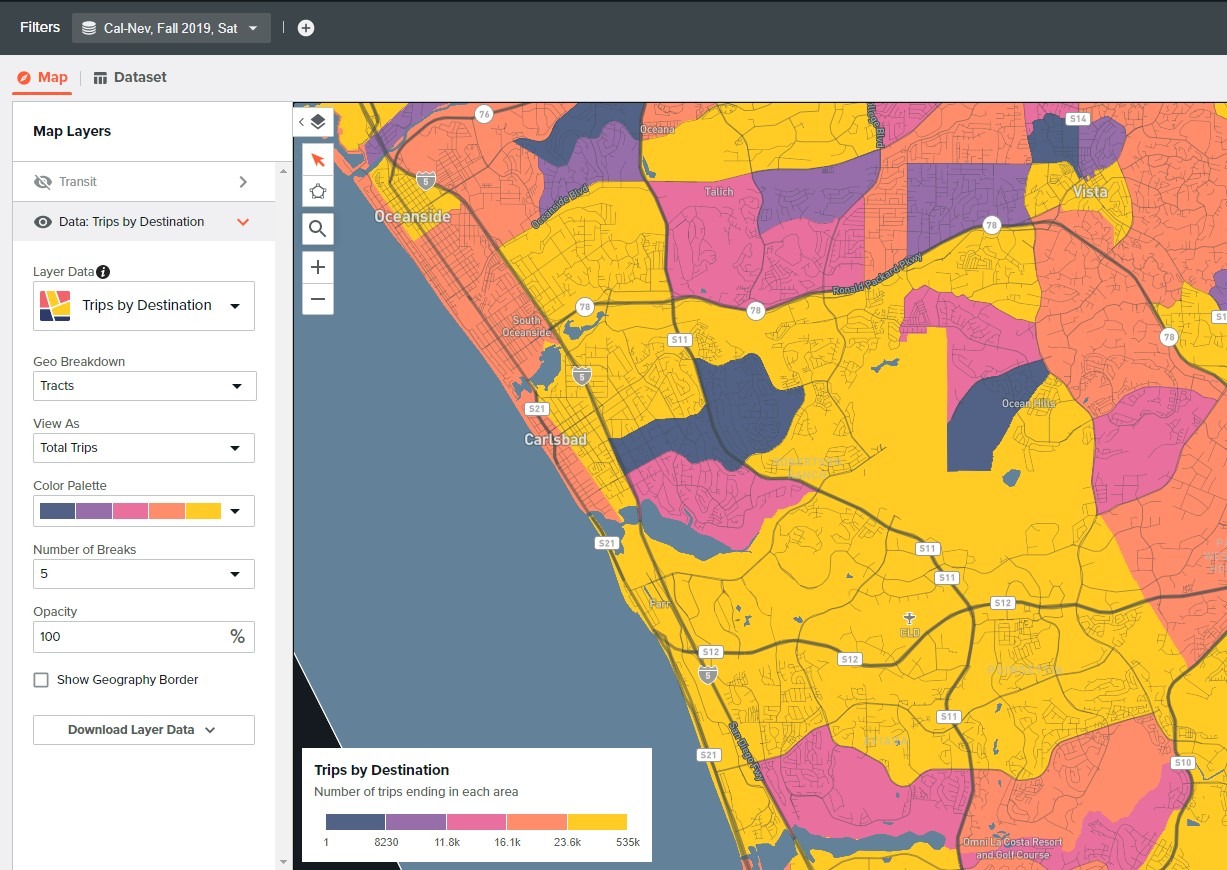
Studying how, when, and where people travel in their community is essential information that guides TMD’s transit planning projects. The travel demand modeling platform Replica has become an important component of this work at TMD because of its depth of information in assessing current travel patterns between geographic areas and with a number of specific demographic and trip-related filters. TMD collaborates with clients to design study area zones that help to analyze general community travel patterns and to ensure that transit service is meeting these demands. Replica also allows for a comparison of travel patterns over time which is useful in understanding the impact of COVID-19 on regional travel behavior. TMD is in communication with the Replica team to review and recommend further applications of the tools that Replica offers and is excited by upcoming features that will inform the development of our projects.

Visualize performance metrics
Tableau
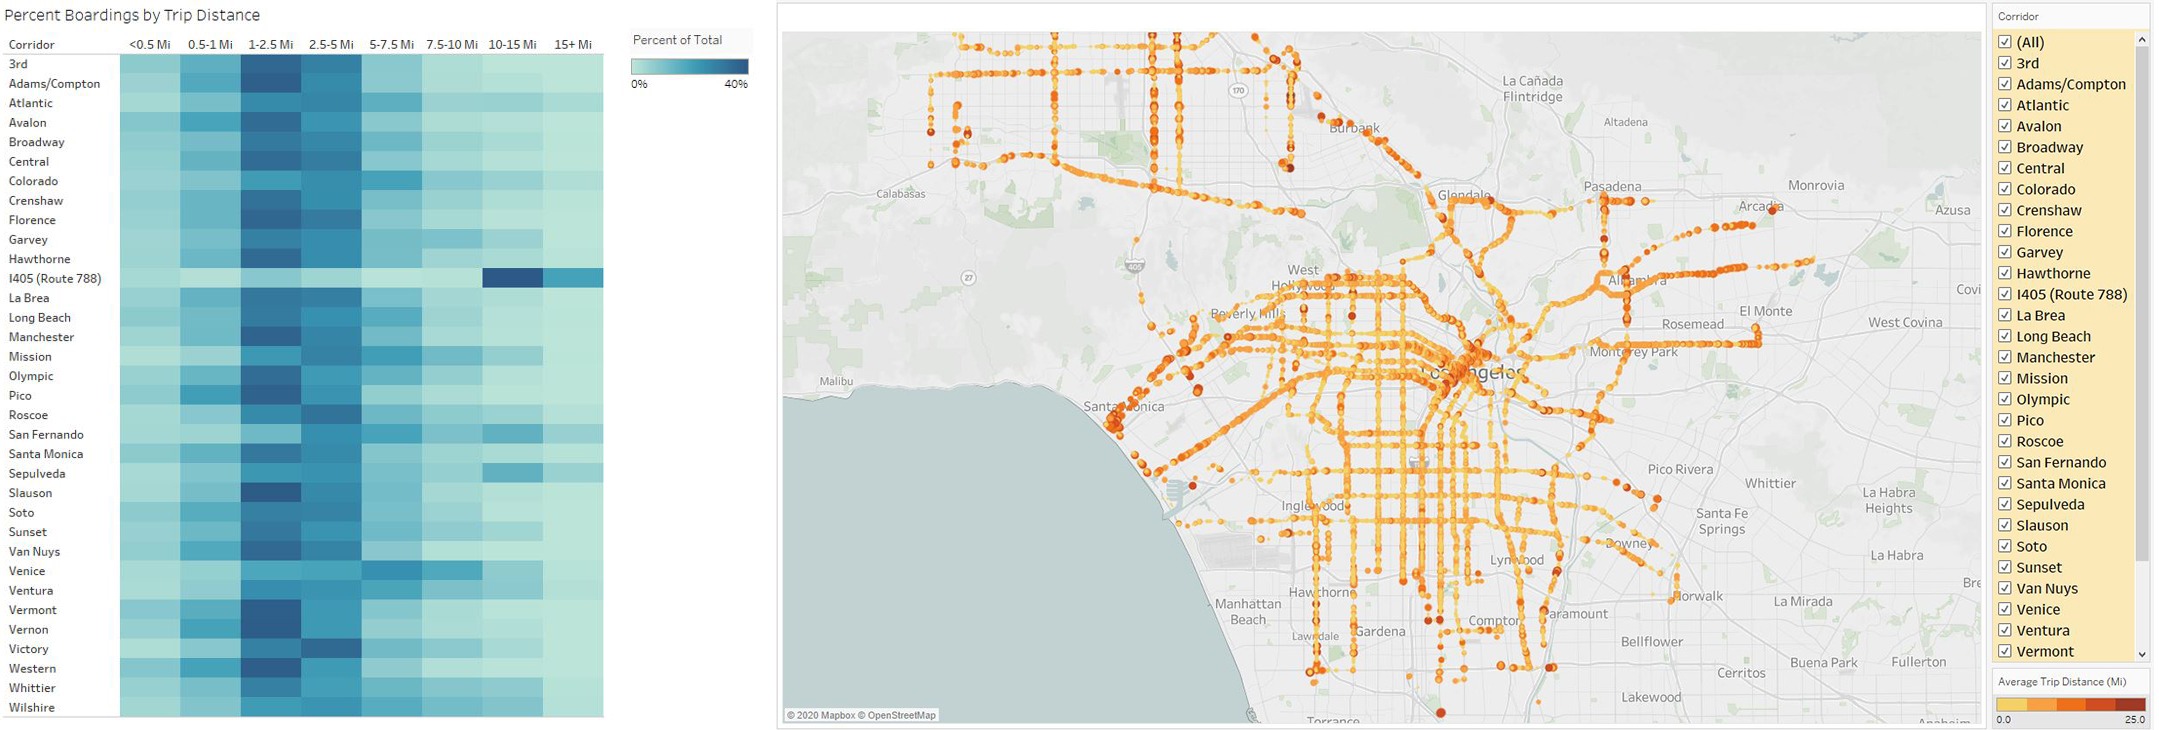
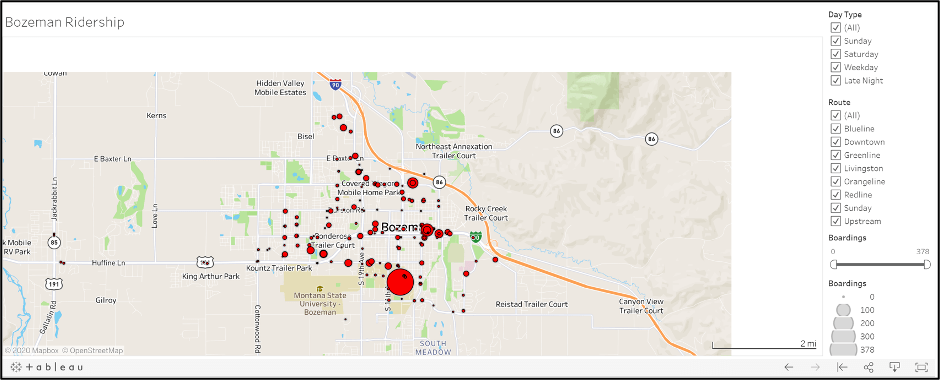
Data is only as useful as the story it tells and the insights that can be gained from it. As part of the data analysis and existing conditions assessment that TMD conducts with every COA project, we develop rich, dynamic dashboards using the Tableau platform. These charts, maps, and other visualizations help our clients to know they are telling the right story and ensure their staff and the public understand the existing strengths and weaknesses of a transit system and where future investment is warranted. Among other things, Tableau can help you:
- Visualize ridership and other performance metrics spatially and temporally
- Monitor service statistics or performance indicators on an ongoing basis
- Share rich visualization and map dashboards with staff, stakeholders, or the public
Projected revenue and expenses
Financial model
While a transit plan may look affordable today, it is important to avoid surprises after implementation. TMD’s Microsoft Excel-based financial model projects out revenues and expenses over a 10 to 20-year period to ensure the plan is sustainable over the long-term. Using ridership, productivity, fare revenue, and operating expenses, the model equips agencies with the tools they need to manage costs and ensure revenue streams cover ever-escalating expenses. The model is designed to be updated each year as budget projections turn into actual revenues and costs.

Scheduling experts
Optibus™ / Trapeze™ / HASTUS™
TMD schedulers are expert users of Optibus™, Trapeze™, and HASTUS™ so you can take advantage of these integrated, modular software solutions for bus and rail transit scheduling, operations, and customer information. All three software packages can be used on-site or through remote access, giving you access to TMD scheduling experts at any time and place. TMD also uses an in-house tool, Model Journey Times (MJT), to support major running time recalibration work. MJT analyzes millions of AVL records to identify the optimal set of running and recovery times to meet stated OTP and CBA requirements. TMD has been providing the transit industry with best practice scheduling services for over 30 years building on our work developing “Transit Scheduling: Basic and Advanced Manuals” (TCRP Report 30).
- Service Scheduling – Schedule building, capacity and running time calibration, timed transfer coordination, and schedule optimization.
- Vehicle Scheduling – Software rule/parameter configuration, vehicle blocking (trip linking/hooking), block interlining optimization, depot assignment, non-revenue service (pull/deadhead) analysis (including new depot locations), and crew relief requirements.
- Crew Scheduling and Labor Support – Crew scheduling (runcutting), rostering, bid preparation, collective bargaining agreement review, labor negotiation support, and “what if” scenario testing.
- Training – On-site or remote training in basic and advanced scheduling techniques.
- Best Practice Review – Performance analytics, technology tool optimization, and best practice review.
Effective service design
Transit Planning Online Platforms
Efficient and effective service design is essential to ensuring a successful project outcome. Along with other mapping and visualization tools, the TMD team brings extensive experience with transit planning online platforms like Remix™, Optibus™ Plan and HASTUS™ NetPlan. If your organization has a subscription, or procures one as part of the project, we are prepared to utilize it for service design and also assist service planning staff with ongoing use. These platforms allow for an inclusive, collaborative route design and brainstorming process and analysis of service and market impacts. However, we understand some of their limitations and supplement these tools with our own in-house tools and industry expertise.
Forecast ridership and revenue impacts
Fare Model
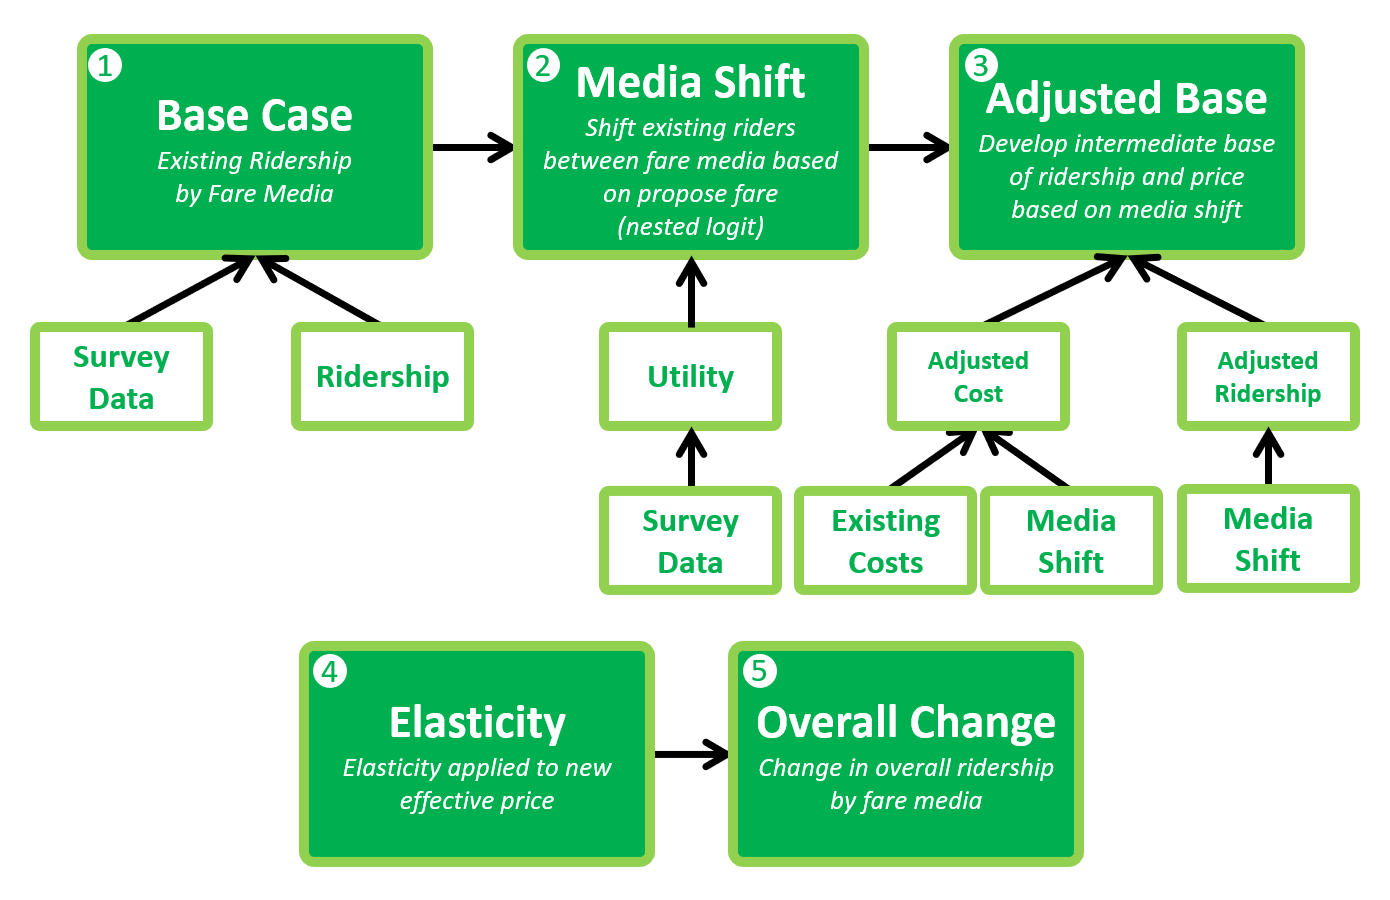
TMD uses a discrete choice fare model that captures changes in ridership and shifts in media across different customer groups in accordance with Title VI and Environmental Justice requirements (FTA Circular 4702.1B). The TMD-developed discrete choice, nested logit model applies variable pricing elasticity and consumer media choice coefficients across various customer groups to accurately forecast ridership and revenue impacts. The MS Excel-based model is customizable for each transit system’s unique circumstances and is available as a “leave-behind” for future transit system use.
Customer Transit Use Patterns
Smart Card Analysis
TMD developed the tool for analyzing Smart Card user travel patterns to better understand how customers are using transit to make specific journeys. Key information like trip lengths on each route and transfers are determined using a series of algorithms that connect individual Smart Card use over time to identify partial and complete journeys. This information is available on the Tableau platform and allows for informed corridor service design decisions (should the focus be on short or long customer journeys or both?) and how often each type of trip is made by the customer. Focusing first on the needs of the most frequent customers is of critical importance in growing and maintaining ridership according to recent industry market research. TMD’s tool links actual customer transit use to corridor service design to maximize overall network ridership performance.
